
Page 9 - 2023 Summer BPU Connection-WQR FINAL v10 PDF
P. 9
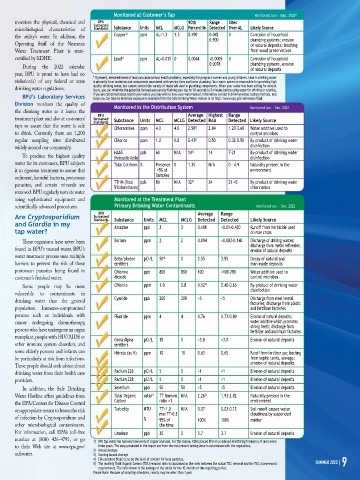
Monitored at Customer’s Tap                        Monitored June – Sept. 2020 1)
      monitors the physical, chemical and   BPU                      90th   Range  Sites
                                   Surpassed   Substance   Units   MCL   MCLG  Percentile  Detected  Over AL   Likely Source
      microbiological  characteristics  of  Standards
                                              1)
                                          Copper    ppm   AL=1.3   1.3   0.490   0.042-   0    Corrosion of household
      the utility’s  water. In addition,  the
                                                                            0.900          plumbing systems; erosion
      Operating Staff of the Nearman                                                       of natural deposits; leaching
      Water  Treatment Plant is state-                                                     from wood preservatives
                                             1)
      certified by KDHE.                  Lead     ppm   AL=0.015  0   0.0044   <0.0005-  0     Corrosion of household
                                                                            0.0078         plumbing systems, erosion
         During  the  2022  calendar
                                                                                           of natural deposits
      year, BPU is proud to have had no
                                   * If present, elevated levels of lead can cause serious health problems, especially for pregnant women and young children. Lead in drinking water
      violation(s) of any federal or state   is primarily from materials and components associated with service lines and home plumbing. Your water system is responsible for providing high
                                   quality drinking water, but cannot control the variety of materials used in plumbing components. When your water has been sitting for several
      drinking water regulations.  hours, you can minimize the potential for lead exposure by flushing your tap for 30 seconds to 2 minutes before using water for drinking or cooking.
         BPU’s Laboratory Services   If you are concerned about lead in your water, you may wish to have your water tested. Information on lead in drinking water, testing methods, and
                                   steps you can take to minimize exposure is available from the Safe Drinking Water Hotline or at http://www.epa.gov/safewater/lead.
      Division monitors the quality of
                                          Monitored in the Distribution System             Monitored Jan. – Dec. 2022
      the drinking water as it leaves the
                                    BPU                              Average  Highest  Range
      treatment plant and also at customers’   Surpassed   Substance   Units  MCL   MCLG  Detected  RAA   Detected  Likely Source
                                   Standards
      taps to assure that the water is safe   Chloramines  ppm  4.0  4.0  2.58    2.84   1.20–3.60  Water additive used to
                                                                       2)
      to drink. Currently there are 1,200                                                  control microbes
                                                                       2)
      regular sampling sites distributed   Chlorite  ppm  1.0   0.8  0.43    0.50   0.32-0.50  By-product of drinking water
                                                                                           disinfection
      widely around our community.
                                          HAA5      ppb  60     N/A  14 3)  14     7-21    By-product of drinking water
         To produce the highest quality   (Haloacetic Acids)                               disinfection
      water for its customers, BPU subjects   Total Coliform  %   Presence  0   1.35   N/A   0 – 4.9   Naturally present in the
      it to rigorous treatment to assure that             <5% of                           environment
                                                         Samples
      sediment, harmful bacteria, protozoan
                                          TTHM (Total  ppb  80  N/A  32     34     21-45   By-product of drinking water
                                                                      3)
      parasites,  and  certain  minerals  are   Trihalomethanes)                           chlorination
      removed. BPU regularly tests its water
      using sophisticated equipment and   Monitored at the Treatment Plant
                                          Primary Drinking Water Contaminants
      scientifically advanced procedures.                                                     Monitored Jan. – Dec. 2022
                                    BPU                                 Average  Range
      Are Cryptosporidium          Surpassed   Substance   Units  MCL   MCLG  Detected  Detected   Likely Source
                                   Standards
      and Giardia in my                   Atrazine   ppb   3      3     0.108    <0.05-0.430   Runoff from herbicide used
      tap water?                                                                           on row crops
                                          Barium     ppm  2       2     0.094    <0.002-0.140  Discharge of drilling wastes;
         These organisms have never been
                                                                                           discharge from metal refineries;
      found in BPU’s treated water. BPU’s                                                  erosion of natural deposits
      water treatment process uses multiple
                                          Beta/photon  pCi/L  50    0   3.55     3.55      Decay of natural and
                                                            4)
      barriers to prevent the risk of these   emitters                                     man-made deposits
      protozoan parasites being found in   Chlorine   ppb   800   800   100      <100-280   Water additive used to
      customer’s finished water.          dioxide                                          control microbes
                                                                           2)
                                          Chlorite   ppm  1.0     0.8   0.52     0.40-0.65   By-product of drinking water
         Some people may be more
                                                                                           disinfection
      vulnerable  to  contaminants  in
                                          Cyanide    ppb  200     200   <5       <5        Discharge from steel/metal
      drinking water than the general                                                      factories; discharge from plastic
      population.  Immuno-compromised                                                      and fertilizer factories
      persons such as individuals with    Fluoride   ppm  4       4     0.76     0.73-0.80  Erosion of natural deposits;
      cancer undergoing chemotherapy,                                                      water additive which promotes
                                                                                           strong teeth; discharge from
      persons who have undergone an organ                                                  fertilizer and aluminum factories
      transplant, people with HIV/AIDS or   Gross Alpha   pCi/L   15   0   <3.0   <3.0     Erosion of natural deposits
      other immune system disorders, and   emitters
      some elderly persons and infants can   Nitrate (as N)   ppm   10   10   0.65   0.65   Runoff from fertilizer use; leaching
      be particularly at risk from infections.                                             from septic tanks, sewage;
                                                                                           erosion of natural deposits
      These people should seek advice about
                                          Radium 226    pCi/L   5   0   <1       <1        Erosion of natural deposits
      drinking water from their health care
                                          Radium 228   pCi/L   5   0    <1       <1        Erosion of natural deposits
      providers.
                                          Selenium   ppb   50     50    <5       <5        Erosion of natural deposits
         In addition, the Safe Drinking
                                                                           5)
                                                        5)
      Water Hotline offers guidelines from   Total Organic   ratio    TT Removal  N/A   2.26    1.93-2.82   Naturally present in the
                                          Carbon          ratio >1                         environment
      the EPA/Centers for Disease Control
                                          Turbidity   NTU    TT=1.0   N/A   0.07   0.03-0.12   Soil runoff causes water
      on appropriate means to lessen the risk
                                                          max TT<0.3                       cloudiness by suspended
      of infection by Cryptosporidium and            %    95% of        100%     100%      matter
      other microbiological contaminants.                 the time
      For  information,  call  EPA’s  toll-free   Uranium   ppb   30   0   3.7   3.7       Erosion of natural deposits
      number  at  (800)  426-4791,  or  go   1)  BPU tap water has had very low levels of copper and lead. For this reason, KDHE placed BPU on a reduced-monitoring frequency of once every
      to their  Web site at www.epa.gov/  three years. The data presented in the report are from the most recent testing done in accordance with the regulations.
                                   2)  Annual Average
      safewater.                   3)  Running Annual Average
                                   4)  EPA considers 50 pCi/L to be the level of concern for beta particles.       SUMMER 2023 | 9
                                   5)  The monthly Total Organic Carbon (TOC) removal ratio is calculated as the ratio between the actual TOC removal and the TOC rule removal
                                    requirements. The ratio shown is the average of the ratios for the 12 months of this reporting period.
                                   Please Note: Because of sampling schedules, results may be older than 1 year